Data Visualization in Tableau
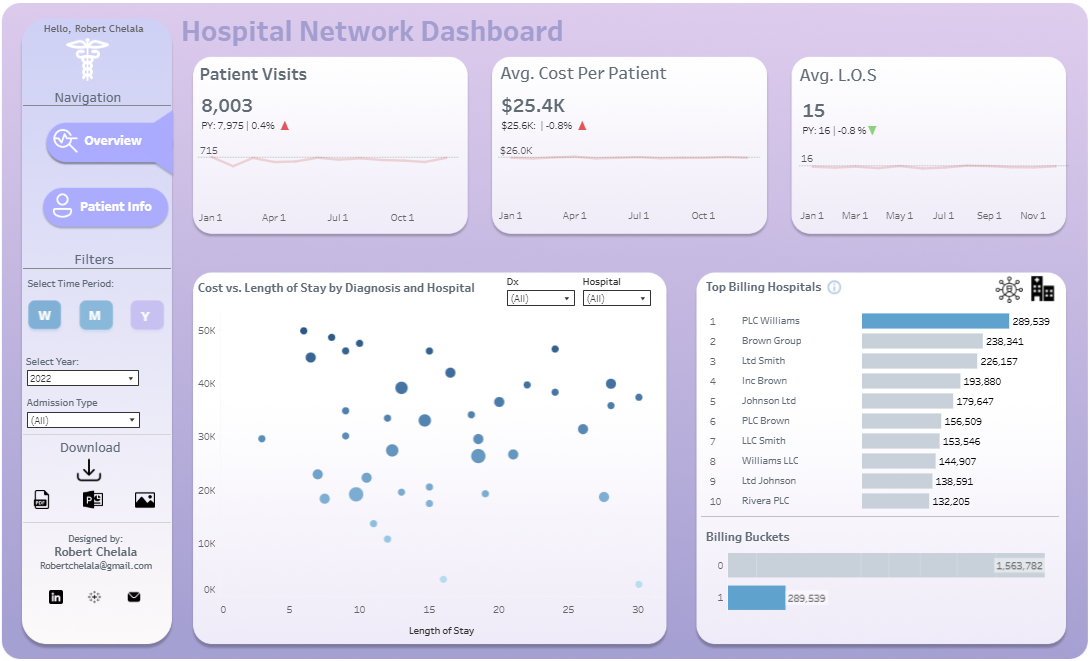
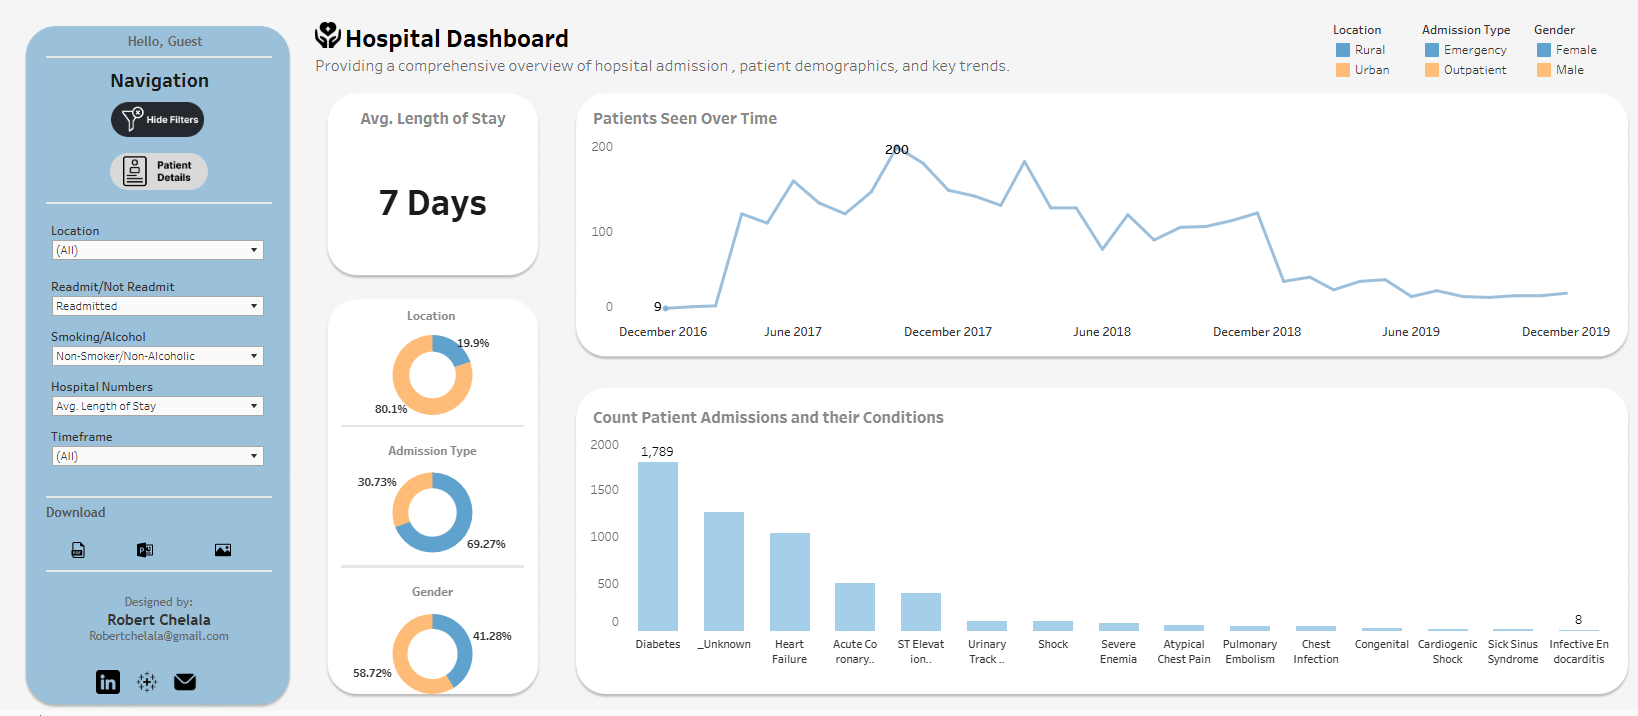
This interactive dashboard provides a comprehensive overview of hospital and provider performance across the network. Users can explore the top 10 hospitals and doctors by billing amount, view trends in patient admissions, analyze average cost and length of stay, and filter data by time period (weekly, monthly, yearly). The dashboard is designed to support strategic decision-making by offering insights into care utilization, financial impact, and clinical outcomes.

.png)

